Review and Edit Classification Results
The “Datapoints” tab lists out all datapoint in this data system alongside their respective Data Category. You can add notes and more information by clicking in the Description field and editing directly in line.
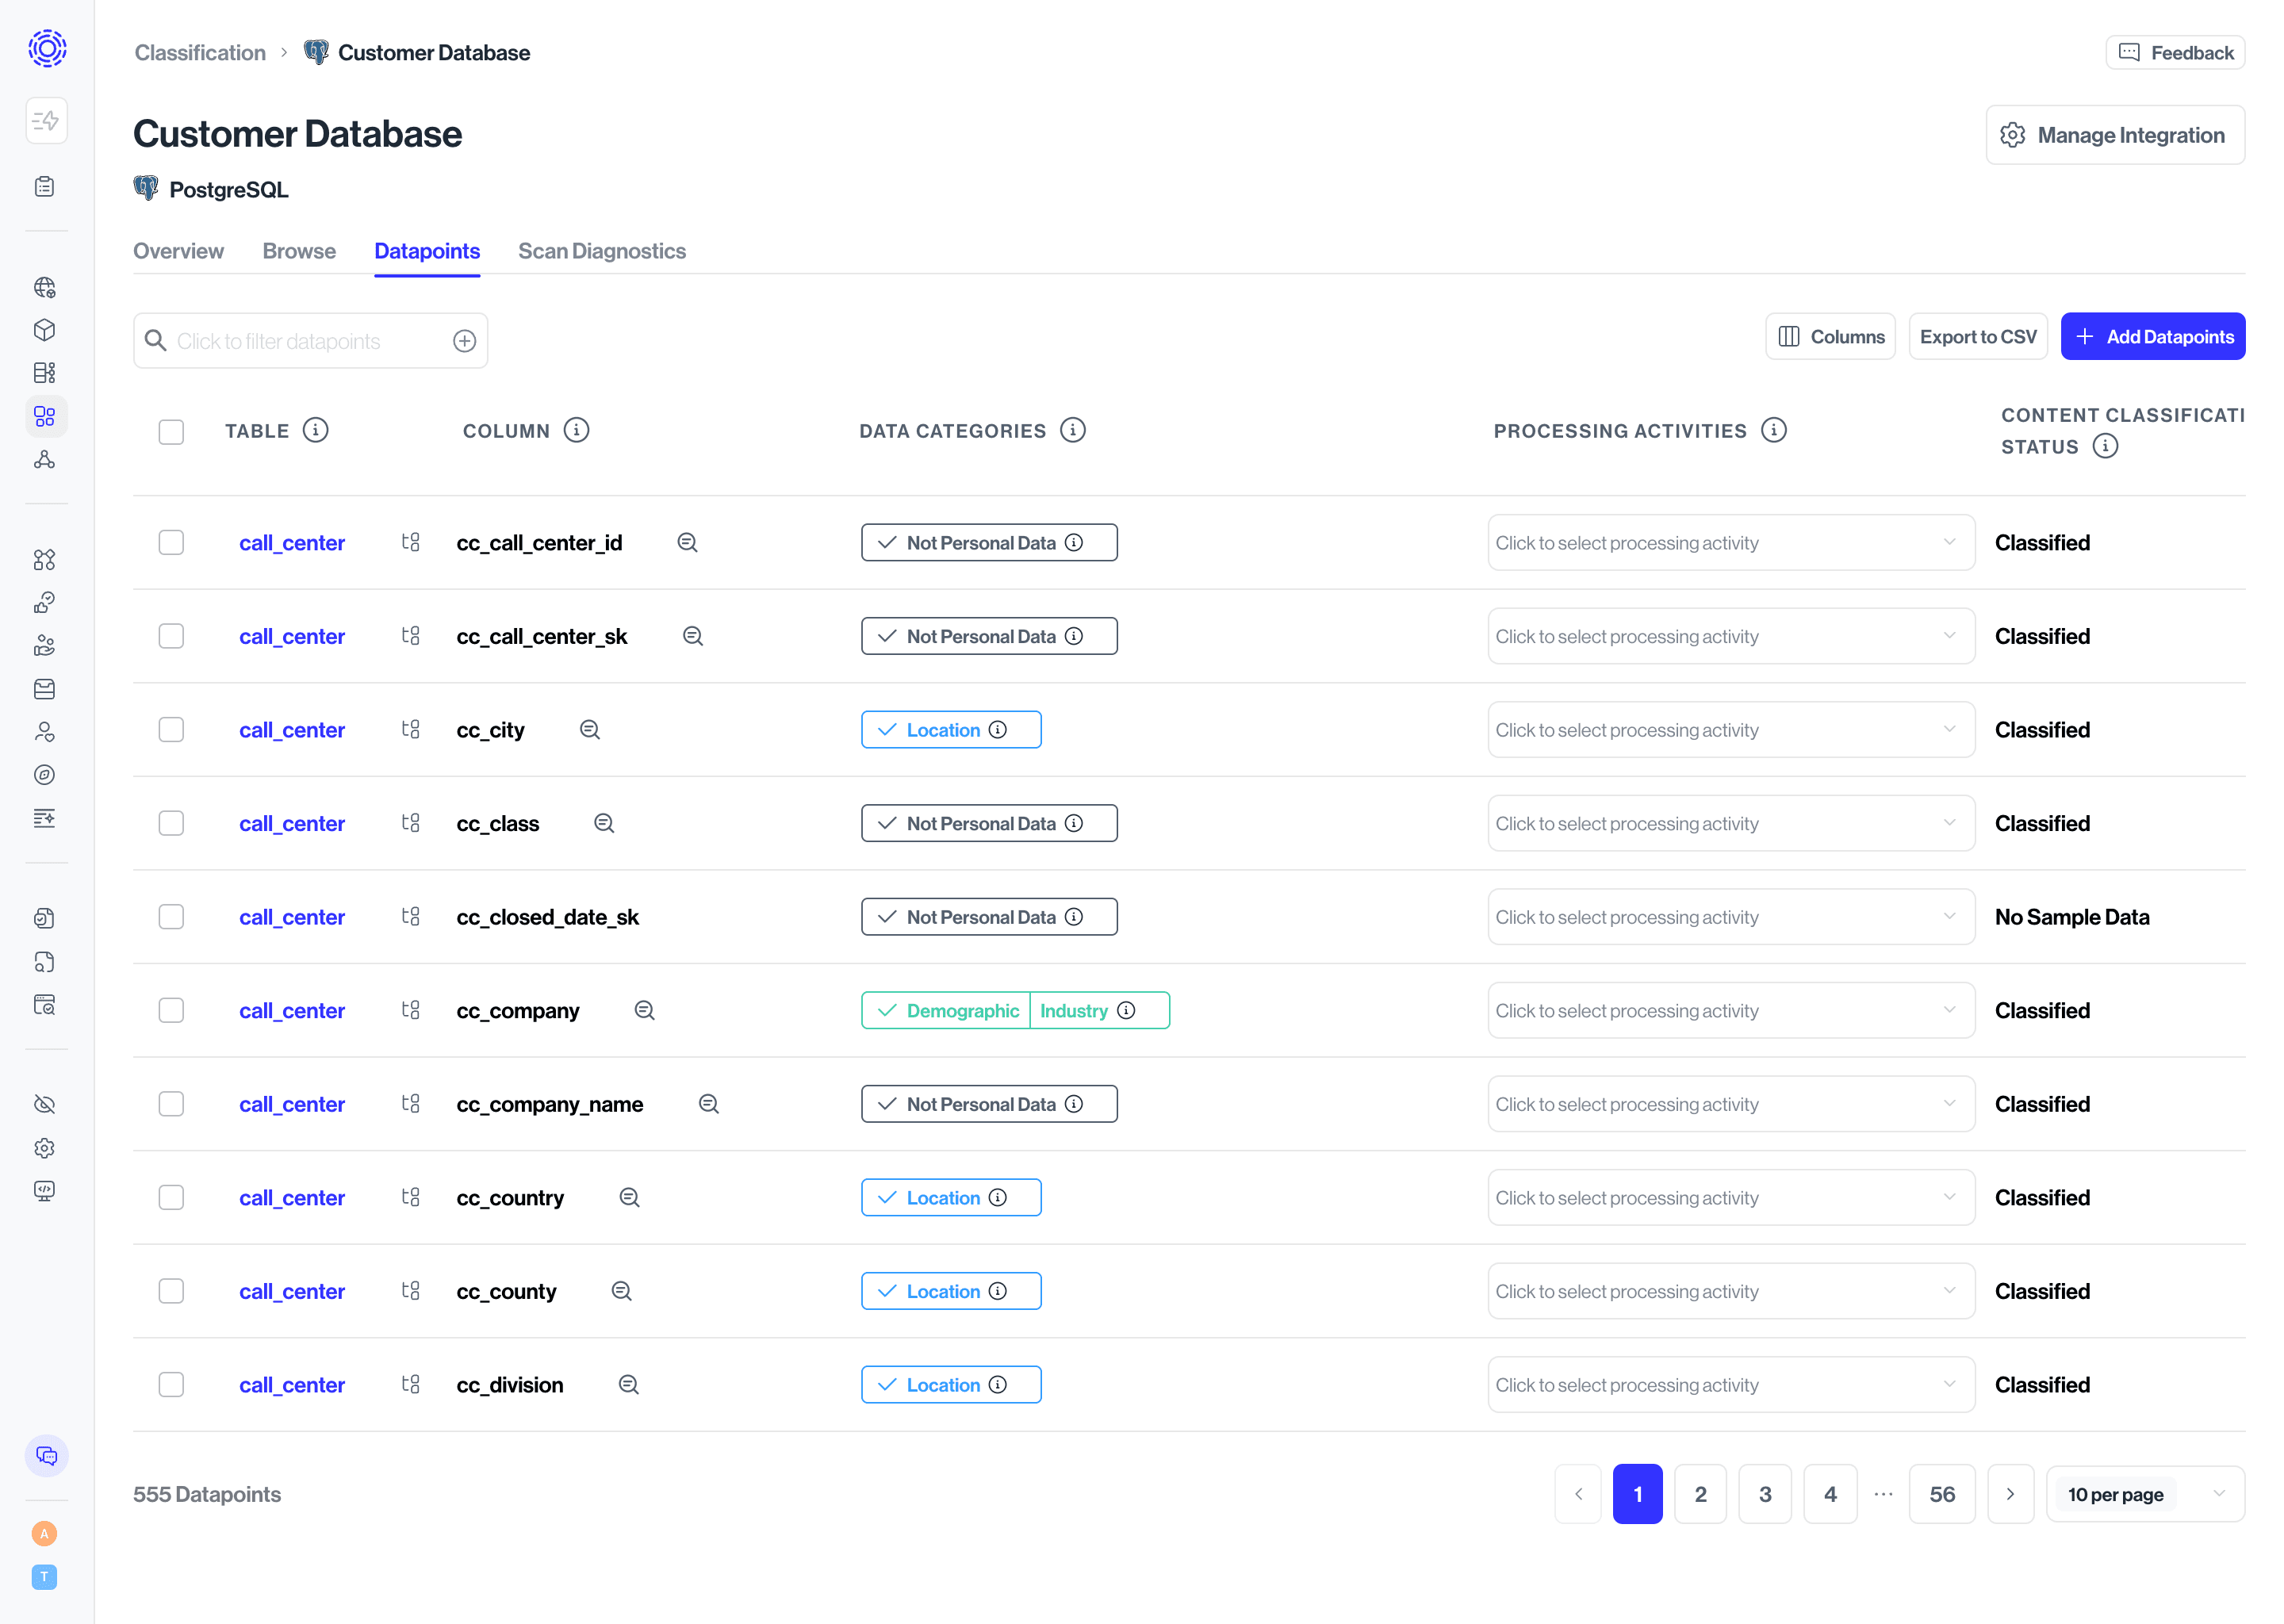
You will see classification categories for each row. We also include sample data below each column for you to reference.
Hover over each column to directly delete, add and edit categories.
Select “Filter” in the top left to filter datapoints by Data Category, Purpose of Processing or classification status.