Data Inventory
Data Inventory is your live-updated base truth of all data systems, objects, vendors, purposes, and other metadata.
In today's data-driven landscape, maintaining a comprehensive understanding of where personal data resides across your organization is not just a regulatory requirement—it's a fundamental business necessity. The Transcend Data Inventory provides this critical visibility, serving as the central source of truth for all personal data in your organization.
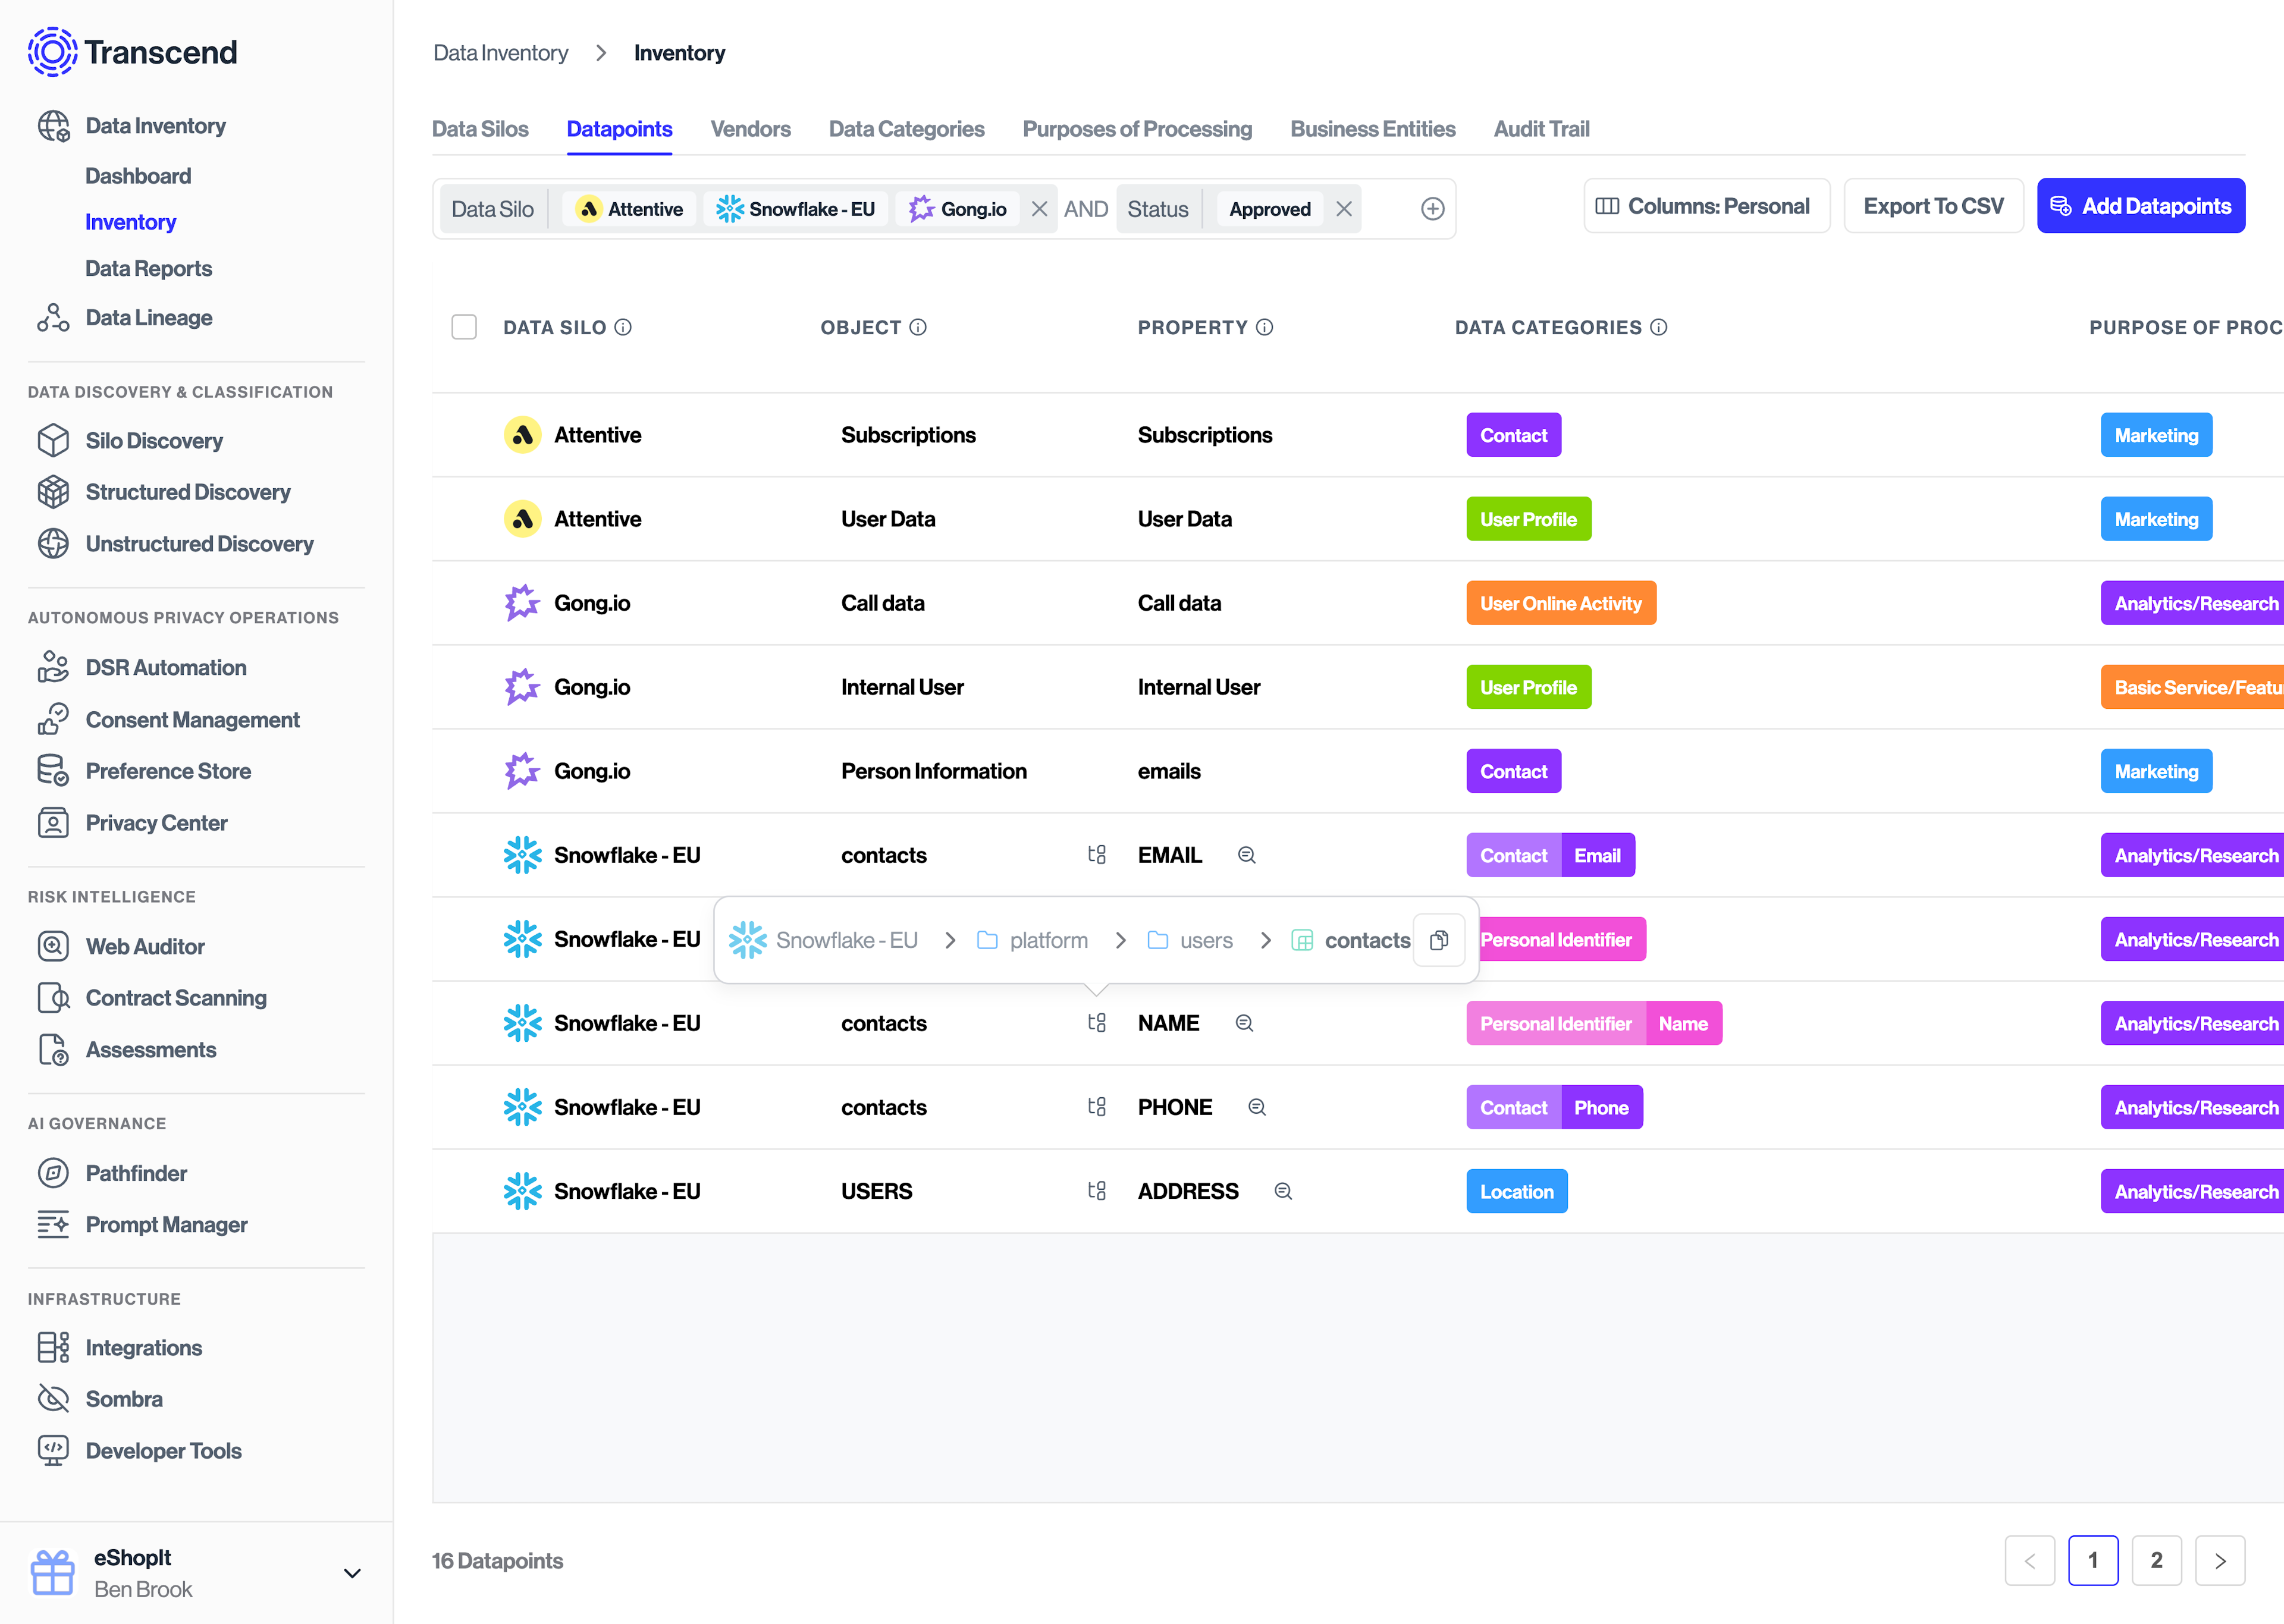
Data Inventory is a dynamic, living catalog of all your data assets, including:
- Data Systems: All systems and locations where data is stored (databases, SaaS tools, file storage)
- Datapoints: Specific objects and tables within those systems
- Properties: Individual fields and columns that may contain personal data
- Metadata: Critical context about the data, including data categories, purposes of processing, vendors, data subjects, and more
Unlike static spreadsheets or outdated surveys, Transcend's Data Inventory is continuously updated through automated discovery processes, ensuring your data map always reflects reality.
Having a comprehensive Data Inventory enables your organization to:
- Meet Regulatory Requirements: Fulfill GDPR Article 30 Record of Processing Activities (ROPA) obligations and similar requirements in CPRA, VCDPA, and other privacy regulations
- Identify Risk: Spot overcollection, sensitive data exposure, or unauthorized data sharing
- Drive Data Minimization: Identify opportunities to reduce data footprint and implement retention rules
- Streamline Compliance: Simplify vendor assessments, DPIAs, and privacy impact assessments
Transcend's Data Inventory offers several powerful capabilities:
- Rich Categorization: Organize data by categories, purposes, vendors, business entities, and custom metadata
- Interactive Visualization: Navigate your data landscape through intuitive interfaces and comprehensive views
- Custom Reporting: Generate tailored reports for stakeholders, from technical teams to executives and regulators
- Robust API Access: Programmatically read and write data to keep your inventory in sync with other systems
- Audit Trail: Track all changes to maintain a complete history of your evolving Data Inventory
Data Inventory serves as the foundation for Transcend's comprehensive privacy platform:
- Powers DSR Automation by mapping where user data lives and how to access it
- Supports Preference Management by connecting user choices to data systems
- Leverages and enhances Discovery products by providing context to discovered data
Before you can fully govern your data, you first need to know where that data is. Transcend Data Inventory is a live view of your data systems and their data objects inside them. It is the base-truth representation of the data in your business, representing what data you collect, how it's used, and where it goes.
The Data Inventory can be automatically populated via data discovery, using Transcend's suite of discovery products:
- System Discovery finds your databases, SaaS tools, and vendors.
- Structured Discovery scans your databases and SaaS tools and classifies the data stored inside them, right down to the field or column level.
- Unstructured Discovery scans your unstructured file and object stores to find and classify personal data inside documents.
Data Inventory Overview
An overview of the Data Inventory, your live-updated base truth of all data systems, objects, vendors, purposes, and other metadata
Tabs in the Data Inventory
Get to know the different information available in the Data Inventory
Managing the Data Inventory
Filter and manage the data hosted in your Data Inventory
ROPA: Quickstart Guide
Generate your first Transcend ROPA report
Creating and Managing Data Reports
Generate customized reports from your Data Inventory, including Records of Processing Activities (ROPA)
Data Inventory API Integrations
Overview of when it makes sense to bulid an API integration to read or write from your Transcend Data Inventory.
API to Read from Data Inventory
Developer guide to understand APIs and Developer Tooling for Reading from the Transcend Data Inventory
API to Write to Data Inventory
Developer guide to understand APIs and Developer Tooling for Writing data to the Transcend Data Inventory