Consent Dashboard
This dashboard provides metrics and visualizations to help you understand website traffic and consent behaviors for the domain(s) where you have added the Consent script.
You can access the dashboard by logging in to Transcend then clicking Consent in the left sidebar.
Limitations of this Reporting
We only provide consent analytics in an anonymous and aggregated format and do not report on consent event data at an individual level in this dashboard. If you’d like to learn more about our rationale for this policy and how you can optionally set up separate analytics tooling to collect analytics at the individual level, see our guide to Individual Tracking.
- Sessions: a unique sessionStorage context. In most browsers, each tab gets a unique sessionStorage context which is persisted until the tab is closed. Note: some browsers allow for restoring this context e.g. by restoring tabs when the browser is restarted.
- Regional Experiences: a customizable combination of UI and consent options established in Transcend that apply to a given region and ultimately determine the consent experience a site visitor experiences. Full documentation.
- Consent Purposes: the various purposes configured in Consent → Regional Experiences → Purposes which can be assigned to Data Flows and Cookies and ultimately regulate what tracking is permitted during site sessions based on configured Regional Experiences. Examples: Sale/Sharing of Personal Information, Functional, Analytics, Advertising.
- Allowed/Disallowed: the default consent value for a given purpose based on the configuration settings in Regional Experiences. For example: a GDPR Regional Experience could be configured so that the default consent values for Functional, Analytics, and Advertising are Disallowed unless a user proactively opts-in.
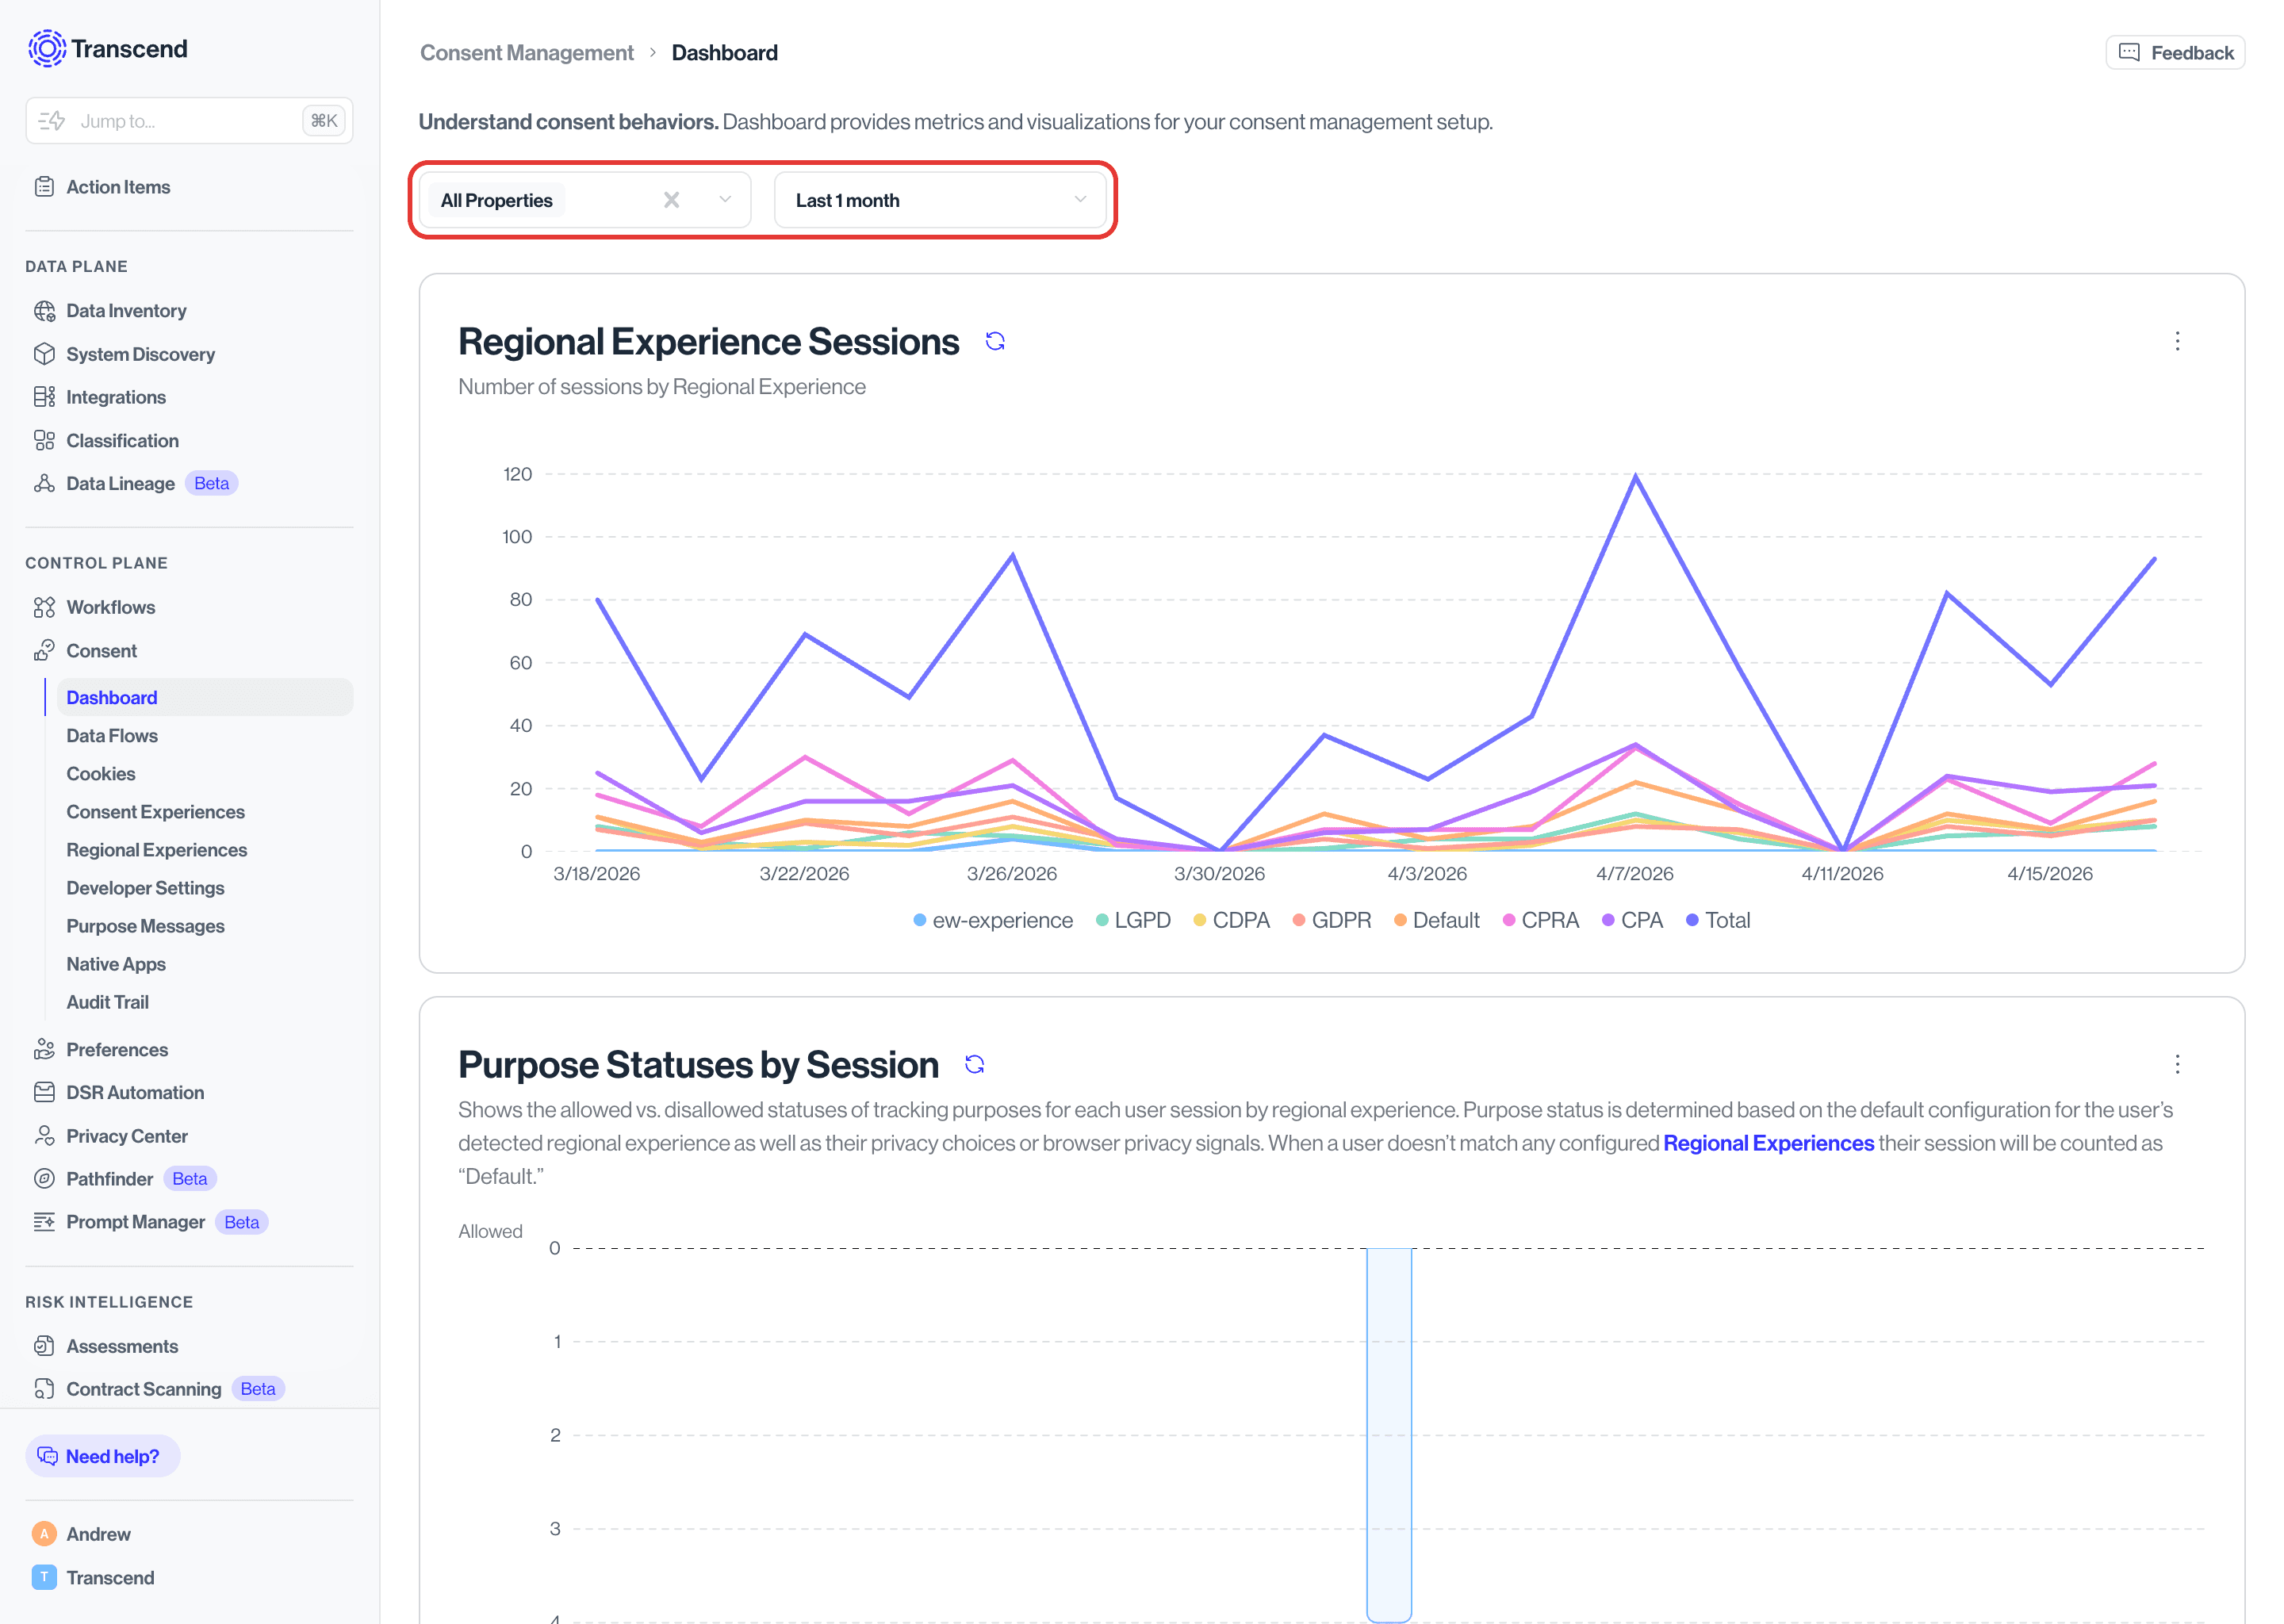
Use the dropdown menu at the top right of the dashboard page to select the time range you wish to view and all visualizations will update.
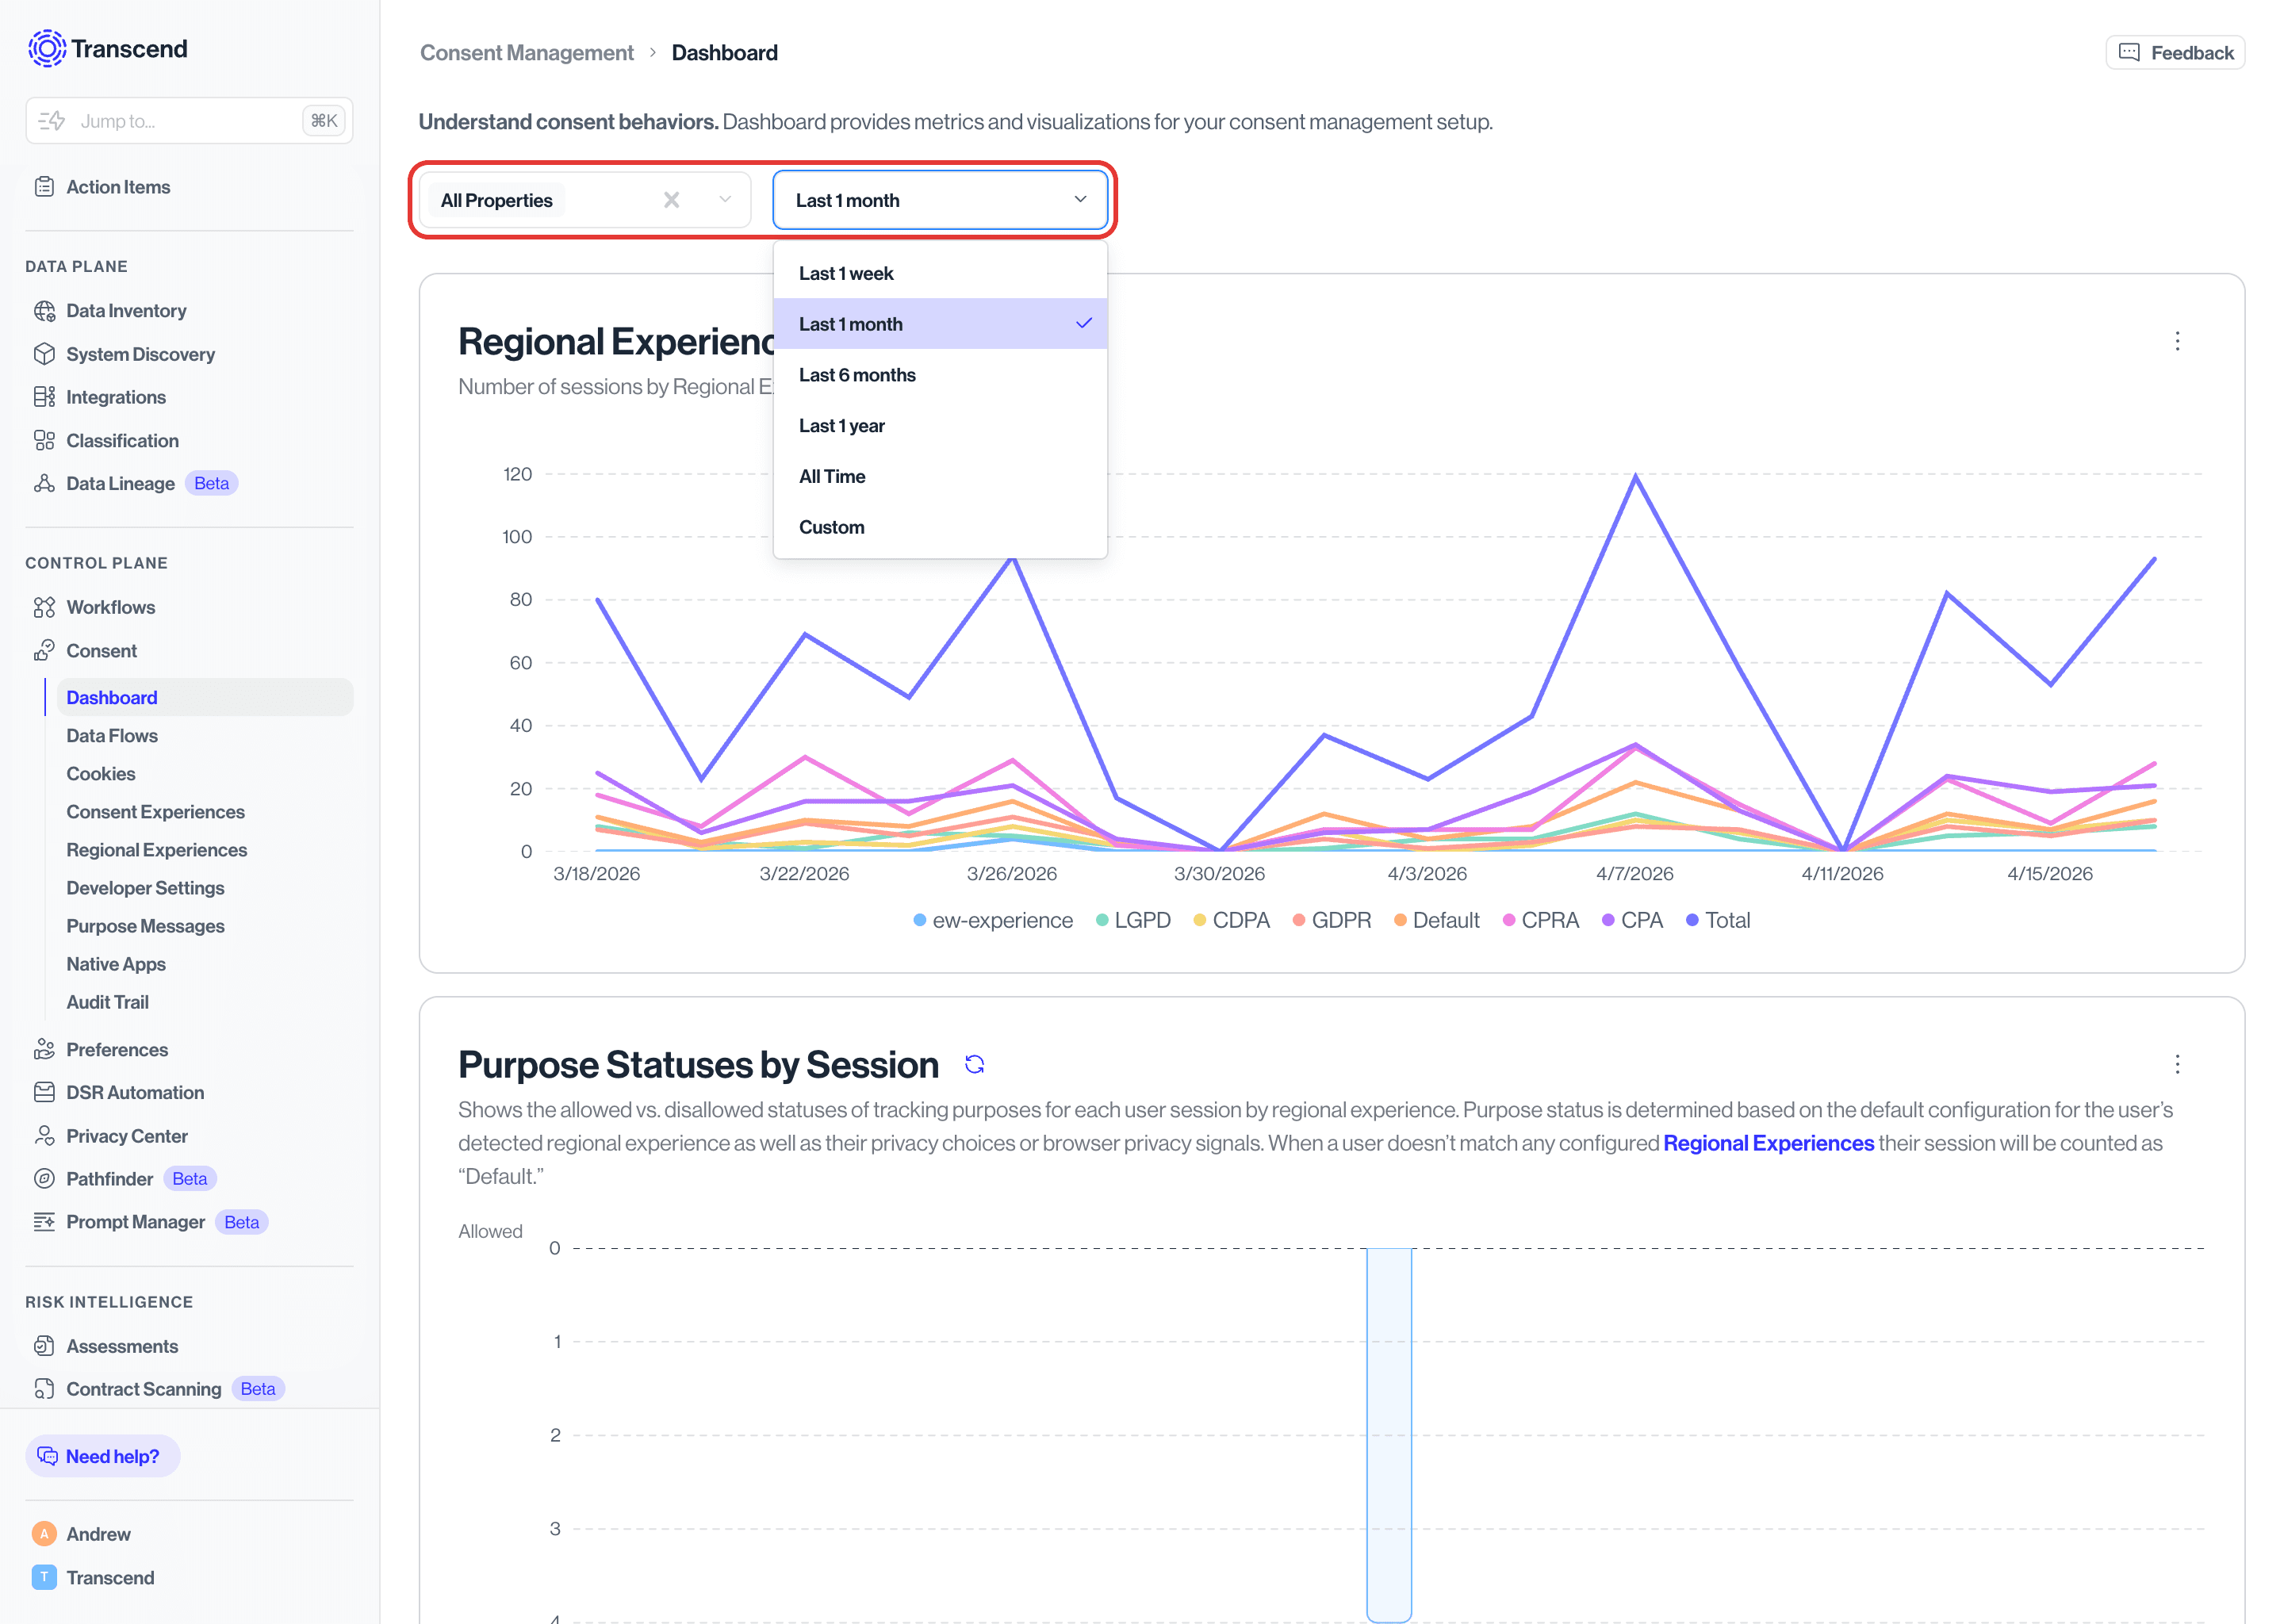
In addition to the pre-fixed time duration options, there is also the option to set a custom date range.
You can see when the data for any given visualization was last updated by clicking the blue refresh icon located to the right of the visualization title.
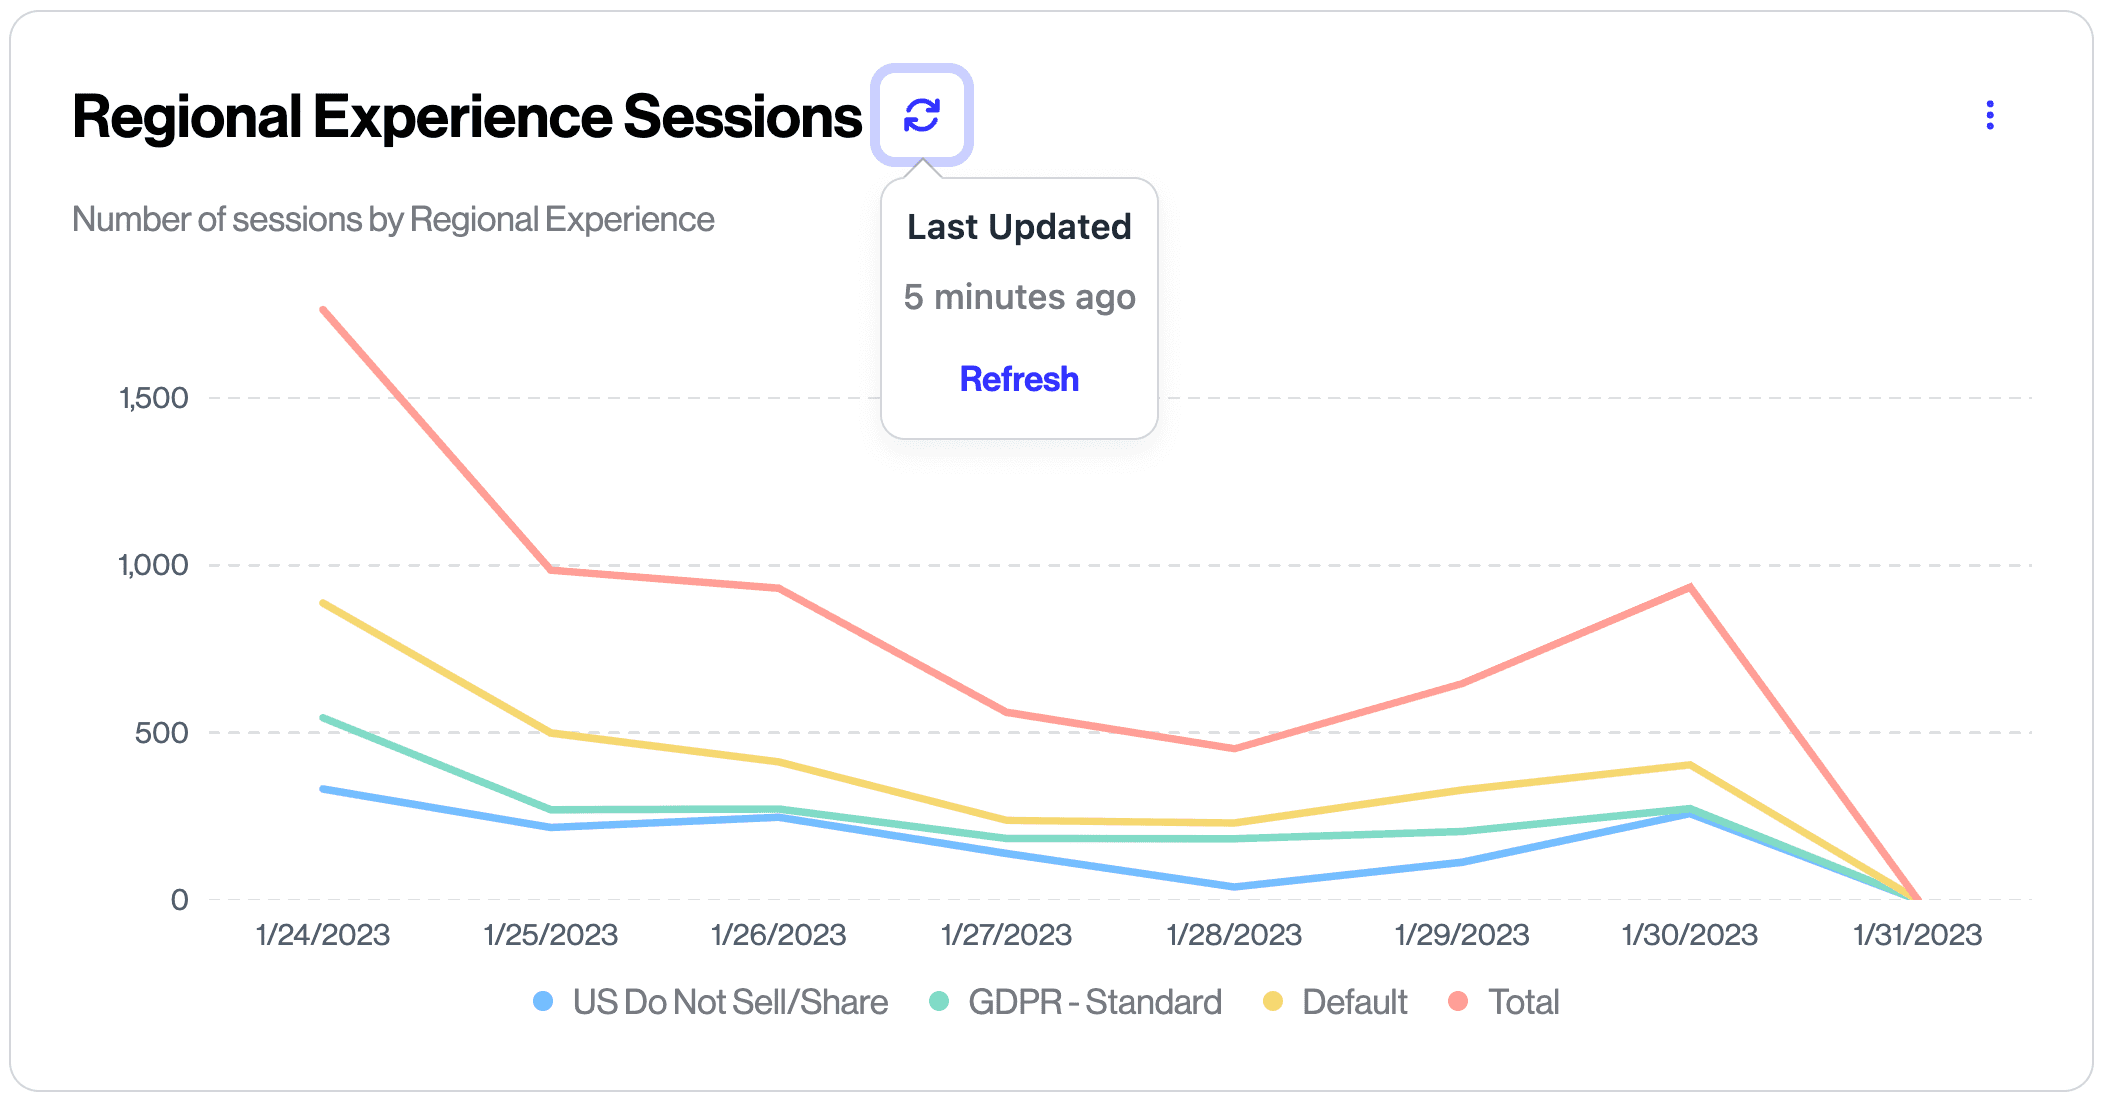
You’ll also be able to refresh the data for just the given visualization from the menu which appears. You may refresh the entire page in your web browser if you’d like to fetch the latest data for all visualizations.
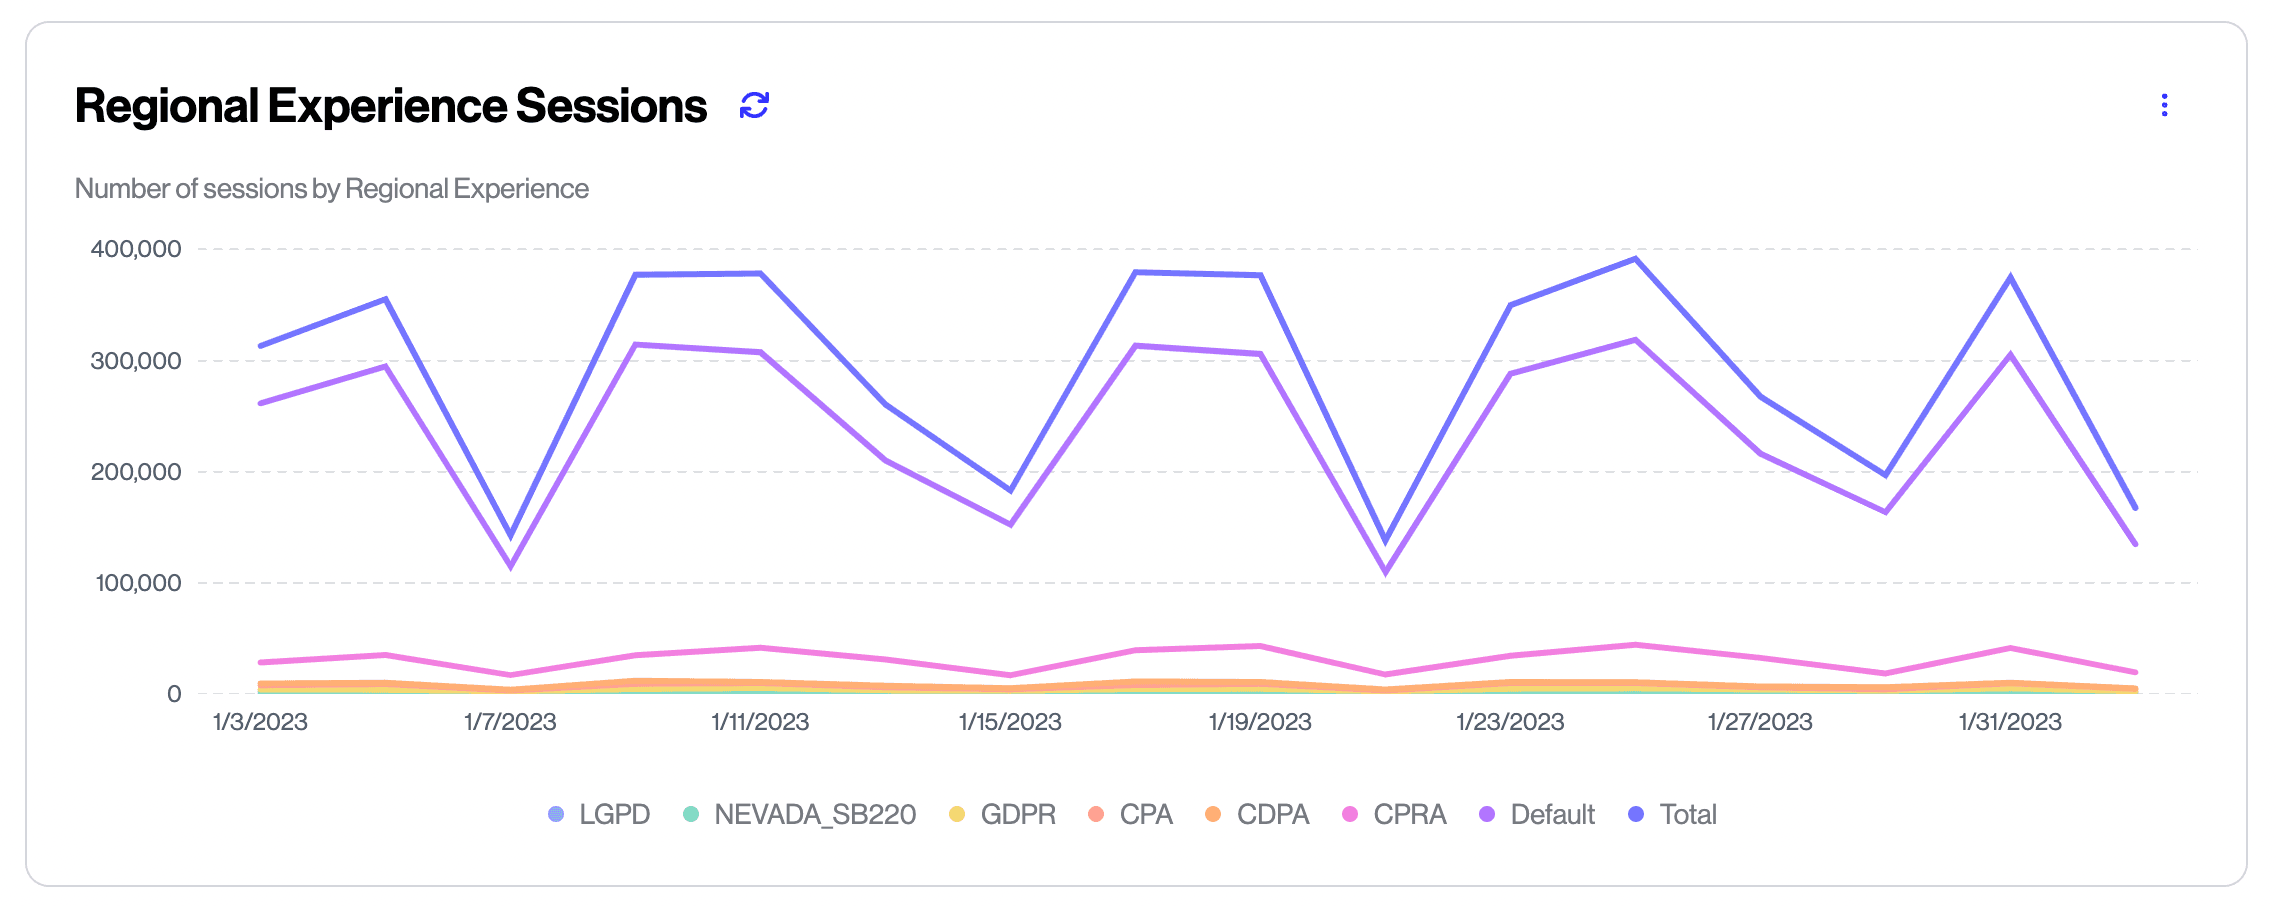
This graph is designed to help you understand how sessions on your site are distributed across the various Regional Consent Experiences you have configured.
Note that a site visitor’s Regional Experience is not the same as their region. For example, we may detect based on IP address that a user is visiting from New York, NY (their Region), but if there is not a configured Regional Experience that includes the New York region then the user will match to the Default regional experience.
This graph shows sessions matching any configured experience, regardless of whether that experience has any Consent Purposes configured. For example, if you have a Default experience configured with no permitted Consent Purposes (say, for users who aren’t in a region with data rights), session information for those visits will still be displayed on this graph.
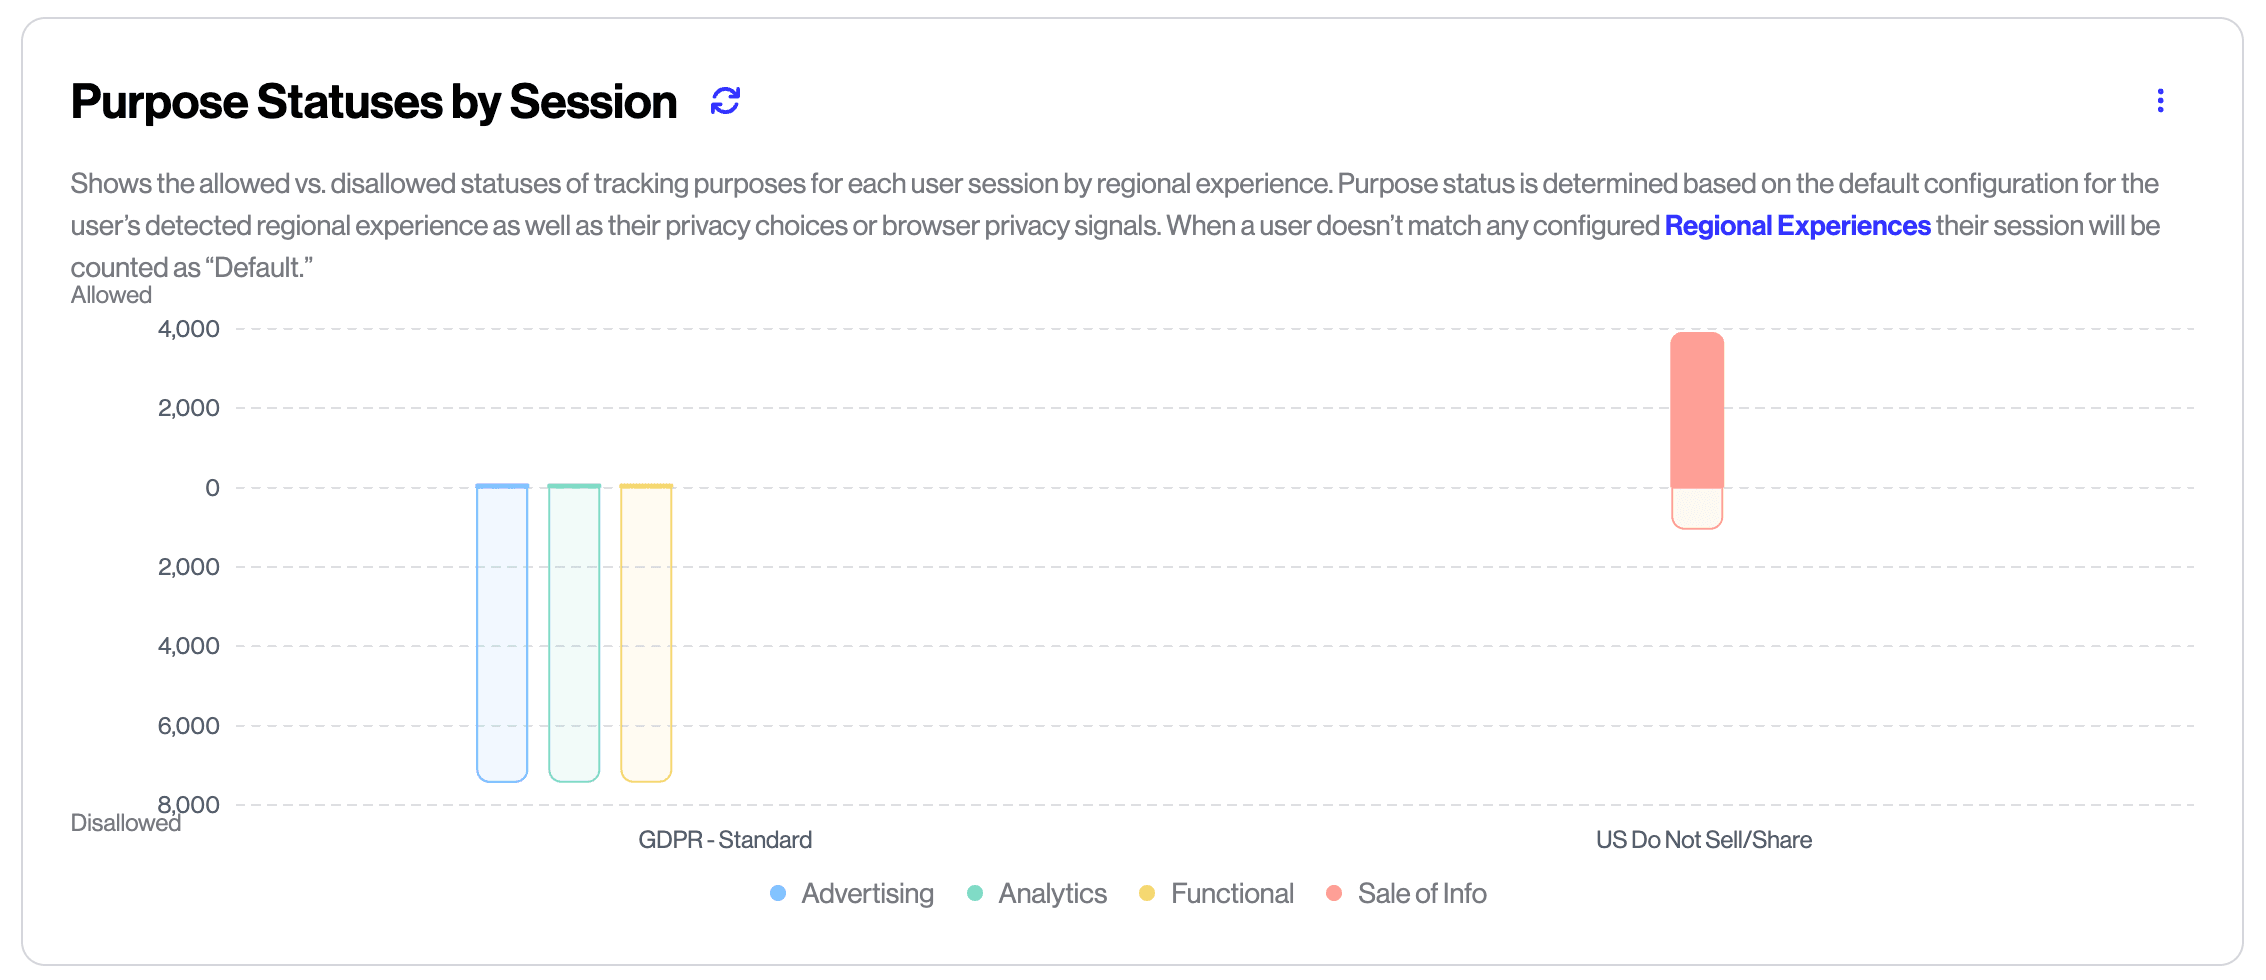
Shows the consent status for users at the time telemetry data was collected on their session (generally ~30 seconds into the session) and displays this data grouped by Regional Experience the user matched. The consent value may be the default value assigned based on the regional experience (identified in the hover pop-up as “(Default)”), or may be from a user actively opting in or out via a banner, footer link, or browser privacy signal.
Because this graph only shows data for Regional Experiences with at least one purpose configured, the total session volume displayed across all bars may be lower than on the Regional Experience Sessions graph which includes sessions where no purposes are configured.
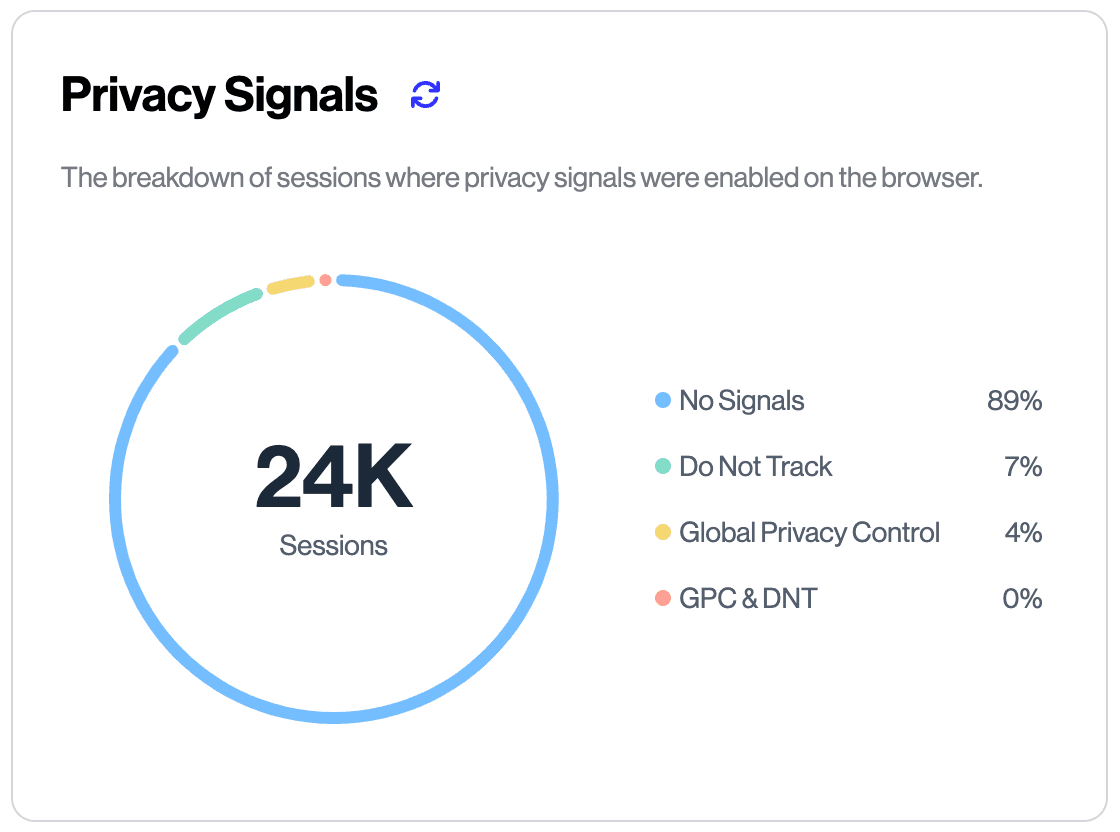
Shows a breakdown of all sessions by whether the visitor was using browser privacy signals like Do Not Track or Global Privacy Control (GPC). This chart shows sessions with detected signals independent of whether those signals were actually respected by configured regional experiences.
Example: if a user in Montana visits your website from a browser using the GPC signal, but does not match any Regional Experience configured to respect that signal, then the signal will not be respected during their session. However their session will still show on this graph under the GPC category.
Remember: you can customize what Privacy Signals you choose to respect for any given Consent Purpose in Consent → Regional Experiences → Purposes.
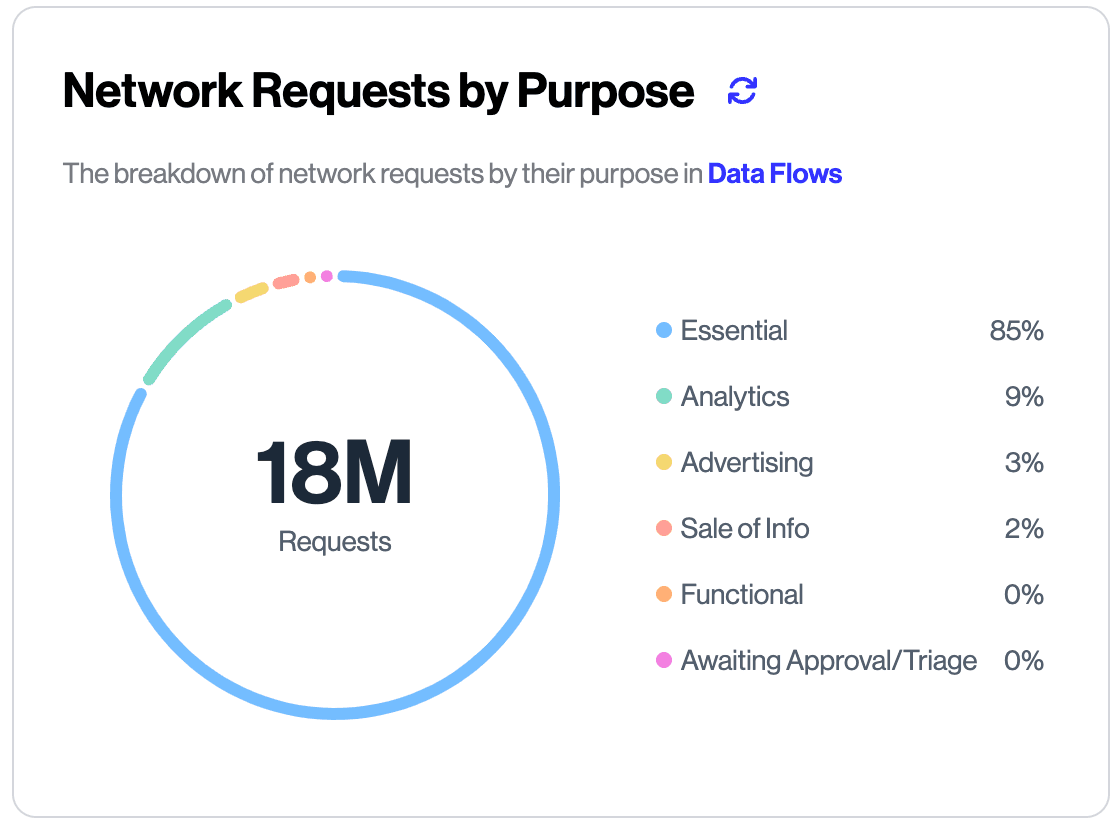
This graph shows detected network requests by the purpose assigned on the Data Flows page. This is a great way to quickly understand the volume of tracking and other requests happening across all user sessions and to understand progress made triaging data flows.
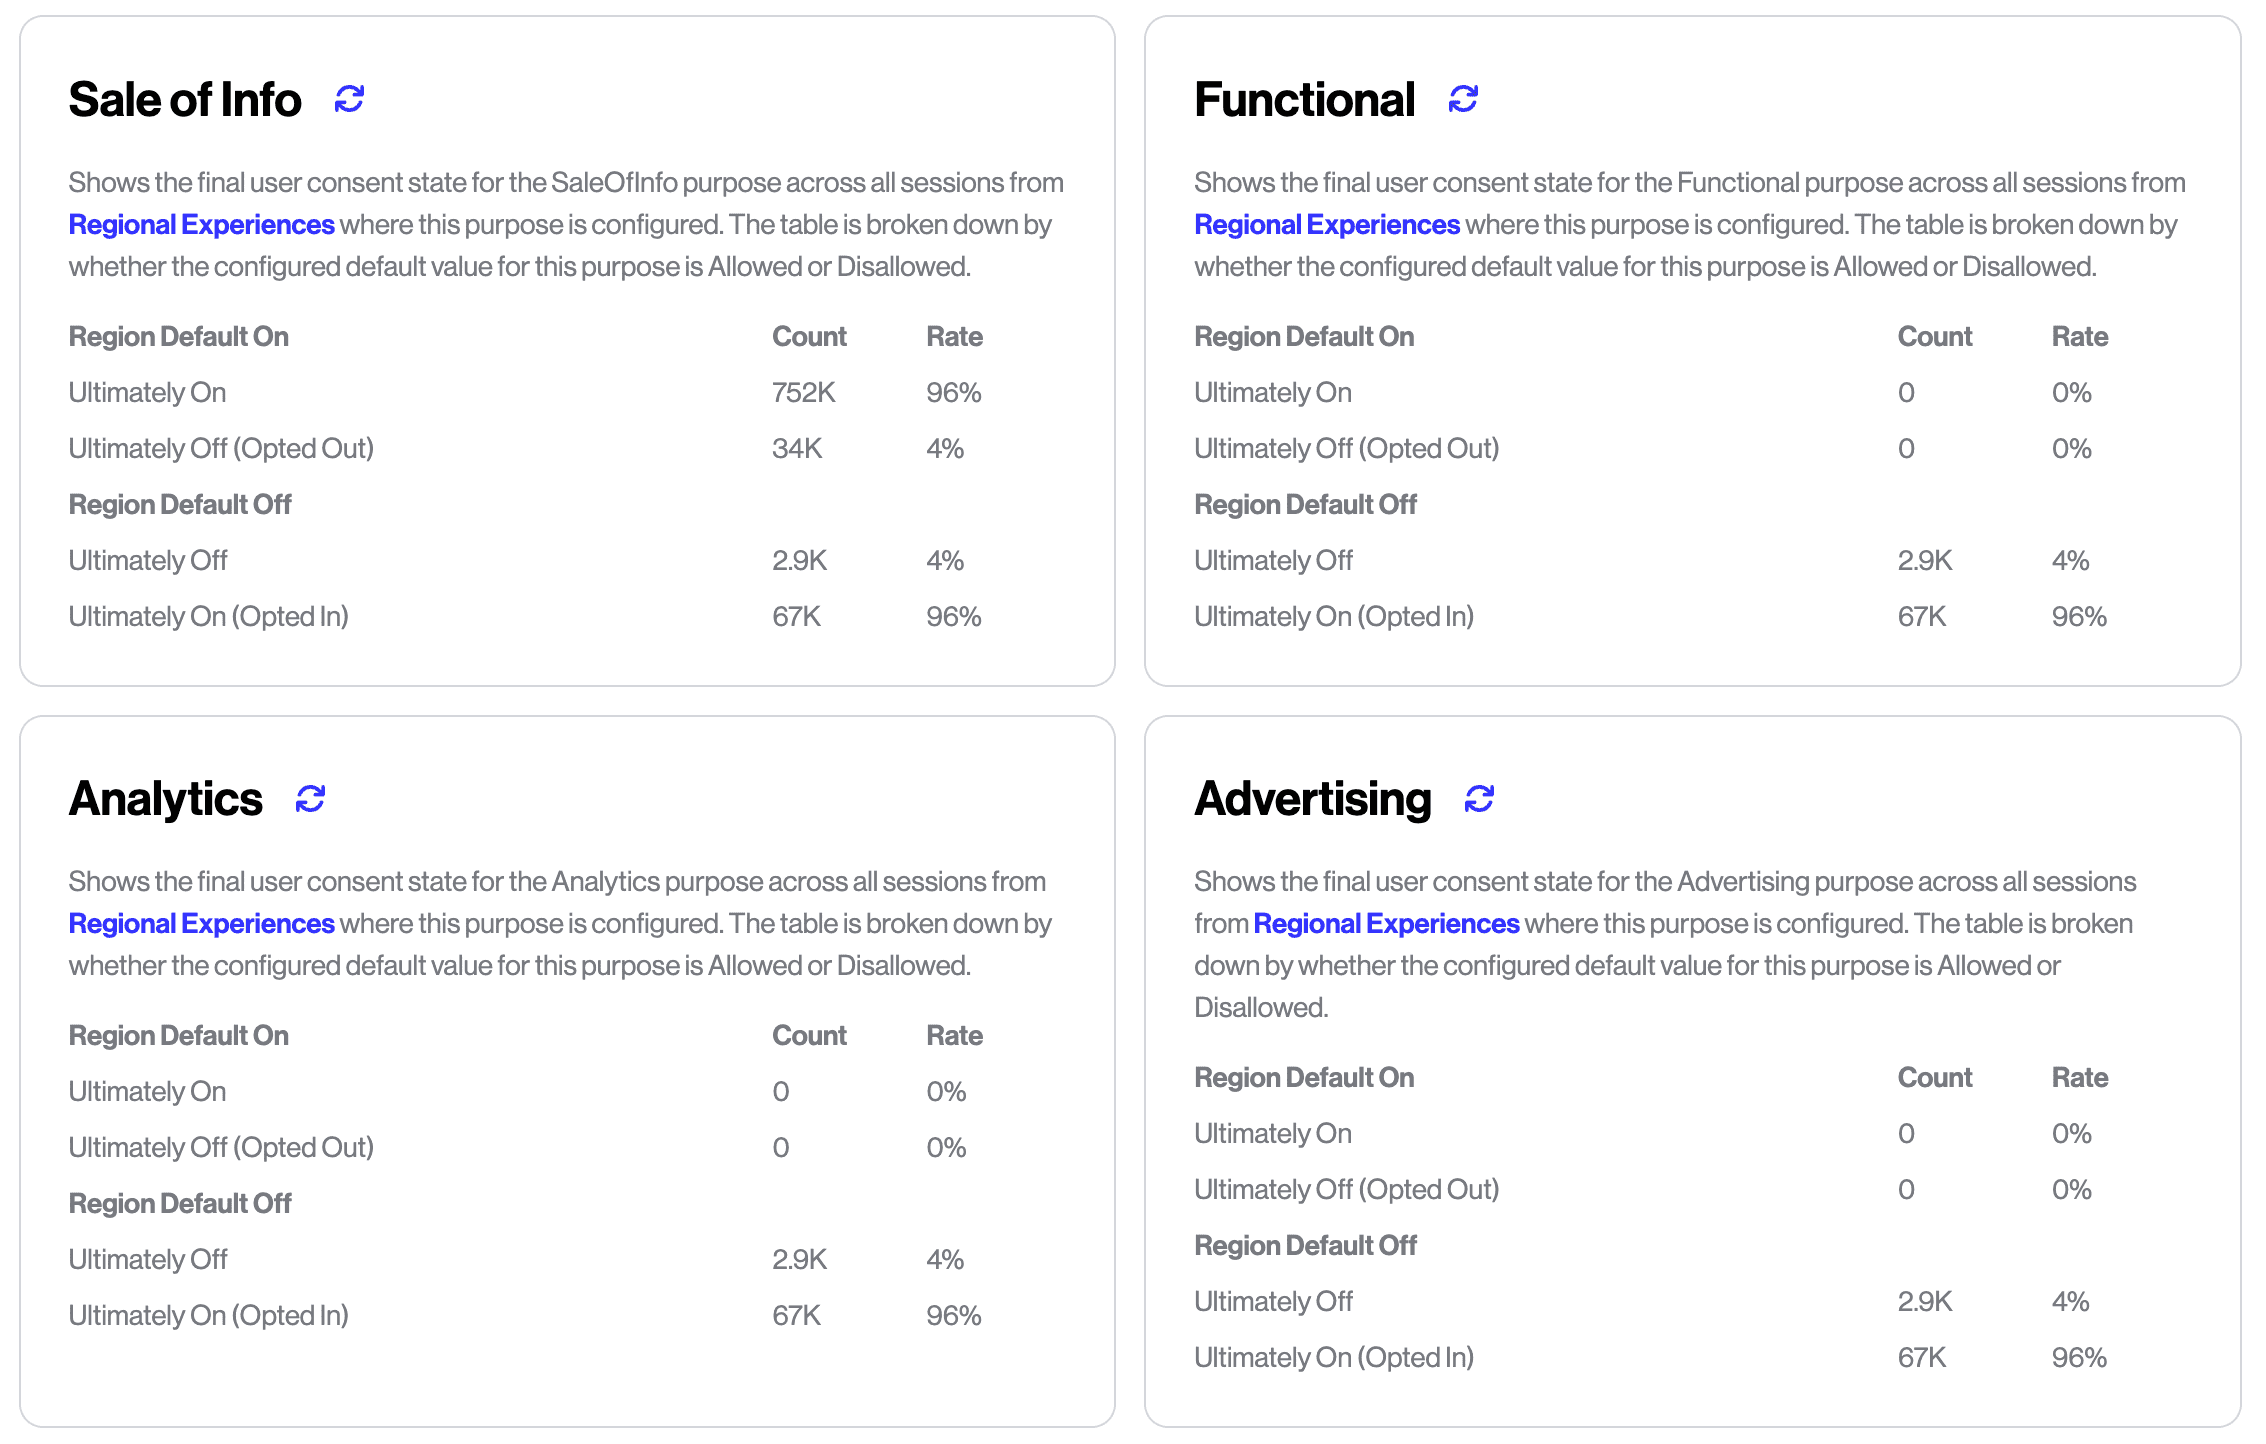
These tables are meant to help you understand how site visitors are making changes to their consent settings compared to the default settings for their matched Regional Experience. They include data from all sessions matching Regional Experiences where the given purpose for the specific chart in question are configured.
If you want to set up custom reporting that goes beyond what is provided in this dashboard view, we offer a GraphQL API.